
We’re thrilled to welcome back The Entertainment Strategy Guy who will provide a comprehensive breakdown of Netflix’s change in how they provide metrics to us, the general public including advantages and disadvantages to the new system.
A couple of months back at Vox Media’s Code Conference, Netflix co-CEO Ted Sarandos released this little chart which set the internet a fire:
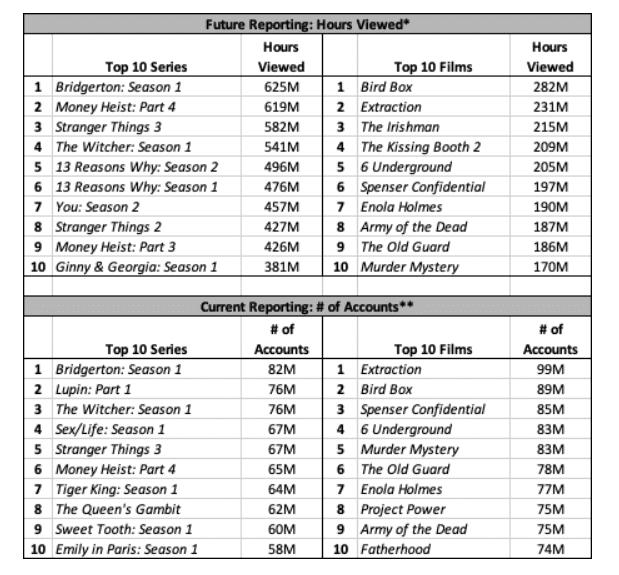
That’s right, for the first time, Netflix revealed not just how many people were watching a piece of content, but also how long. At the time, I wondered why they were being so generous with their data.
And I’m kicking myself for not realizing the actual answer: Netflix had prepared their quarterly report and decided to switch metrics. Previously, they announced how many subscribers watched two minutes of a given TV show or film in the first 28 days. (I called the “datecdotes”.) Going forward, they’ll release the total hours viewed for TV series and films by week. In their words:
Given how much I had previously hoarded Netflix’s precious datecdotes—consolidated on this website into this excellent resource—this Twitter exchange summed up my feelings at the time:
I wish I had a live shot of @EntStrategyGuy’s face as this was announced. https://t.co/1Yo6mup0Zn
— Sonny Bunch (@SonnyBunch) October 19, 2021
If Netflix changed metrics, all those datecdotes I collected over the years would be for naught. Essentially worthless, since I couldn’t compare them to other data points.
Netflix said they were planning to be “more transparent” going forward. Well, I don’t think anyone realized just how transparent that would be! Two weeks ago, Netflix set up a brand new website to share the total hours viewed for the top 10 shows and films across both English and non-English content. Forty data points each week! And they provided 20 weeks of data at the time!
Hallelujah, that’s a lot of data!
And while I’m thankful for it, let’s not downplay the change. Netflix did change metrics, which means going forward it will be much harder to compare performance from 2020 and before to 2021 and beyond. It’s also worth pondering why and what the different metrics can tell us. Overall, different metrics aren’t really good or bad, they just are. Hours viewed is a very useful metric, but so is unique customers (households) watching. Let’s explain.
What’s Better Total Hours Viewed or Unique Households?
Both.
When it comes to data, I’m greedy. If you asked me what piece of data I’d like, my usual response is to ask for more data. Data analysts worship the demon Mammon when it comes to data: More is better. Here’s a real-life photo of me clutching my data:

This isn’t just greed, though. Only having one metric is the problem. To truly understand trends, you need multiple measures of success.
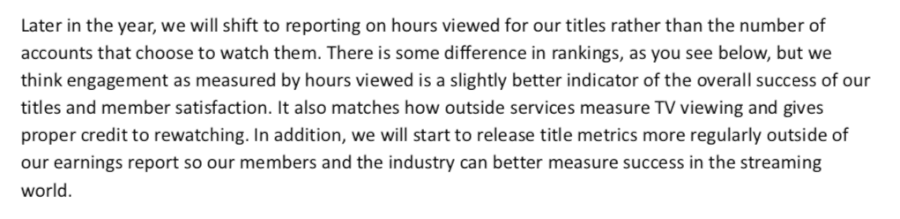
Say you want to know the best three point shooter in basketball. Shooting percentage is a useful place to start. Here’s a histogram of all the NBA players who’ve attempted a three-point shot this season:
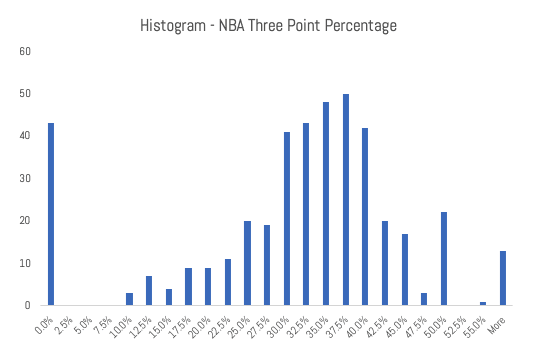
Of course, some guys on this list barely shoot threes. Which is why you have the two tails of some folks who have ridiculously high percentages and some who are at zero. To get a better feel for who is a good three-point shooter, let’s add in how many shots players have taken:
That’s a much more accurate description of three-point shot quality. And not surprisingly, the best three-point shooter is Steph Curry.
Or take an issue like schools. Test scores matters a lot, but so do graduation rates. If you just measured test scores, schools could kick out low performing students. If you just measured graduation rates, schools would pass kids who can’t read. So you need to track both metrics, graduation rates and test scores. One metric hardly ever captures the reality of the situation.
If I had my druthers, streamers would release both unique customers and streaming hours for all of their content. But I don’t rule the world, so most streamers don’t release any data. And Netflix just changed which metric they released. So let’s discuss both unique customers and total hours viewed to see which is better.
The Advantages of Unique Customers (or Households, Subscribers, Members or Accounts)
Up until now, Netflix has released a “uniques” metric. Meaning they count all the accounts that watched at least two minutes of a given show or movie. Netflix has used a few different words to describe this—customers, accounts, subscribers, households, etc—but all get to the idea that they’re measuring a unique log-in who watched some length of a piece of content.
(Presumably different profiles aren’t counted multiple times, again because of the households terminology.)
Of course, even a straightforward metric like this requires some subjective analysis. For example, how long does a unique account need to watch to “count”? This was the subject of Netflix’s first metric shift. Back in 2020, after releasing viewership numbers based on subscribers who watched for “70%” of a piece of content, Netflix shifted to subscribers who watched “at least 2 minutes” of a piece of content. Here is a breakdown of how many we got of each type:
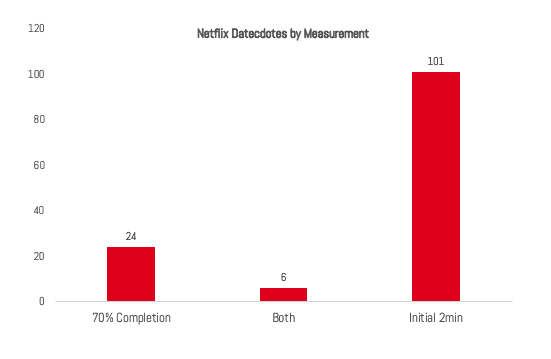
Reportedly, Netflix calls 70% viewers “watchers”, customers who watch 2 minutes “starters” and folks who watch 90% “finishers”. Really any of these metrics are useful, depending what you’re measuring. If you want the best idea of customers who actually are watching a piece of content, either 70% or 90% is probably best.
Unique viewers is pretty useful because it gives a good approximation of “reach” or the number of folks engaging with a piece of content. It’s also very useful for the marketing folks, because, presumably, if they can get a lot of people to start something, they did their job. (If they don’t finish, then it means the content wasn’t good.)
Unique viewers also puts shows on roughly equal footing. A smaller show like Lupin can compete with a gigantic multi-season series like Stranger Things because it isn’t about total volume of episodes, but just unique subscribers watching it.
Unique customers, though, doesn’t track the number of folks who started a show but failed to finish, something hours viewed can approximate. And for some series, completion rates really do matter. For example, when Netflix released Part Two of season one of Lupin only 54 million households watched two minutes, down 41% from Part One released in January. Here’s a chart I made for subscribe growth or decay after Netflix’s last earnings call:
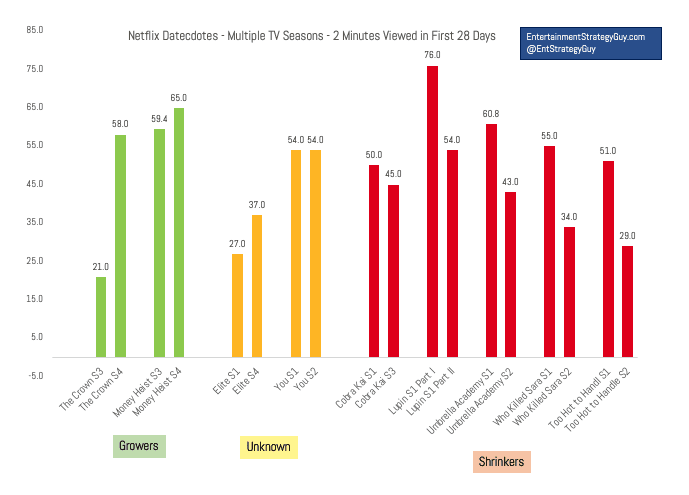
Lupin, in particular, was short. Only 4 episodes in Part 1 and Part 2. If Netflix had released all eight episodes at once, we wouldn’t know how few folks finished it. We’d have assumed that most of those initial 76 million watched the whole thing. Broken up, though, we know a lot of people didn’t finish it.
The Advantages of Total Hours Viewed
Total hours get us much closer to understanding true completion rate. In this case, you can take the total numbers of hours, divide by the number of episodes available, with a presumed completion rate, and guess how many households watched.
“Guessed” being the operative word. For film, since it is a one-off event, with a known time period, this can be fairly precise. But for TV it is a disaster. When I say “presumed completion rate”, those numbers can very wildly. So the error bars are fairly broad. Still, it’s probably more useful than just subscribers.
If there is one reason this change will be “awesome sauce”—a technical term—it’s that total hours viewed is how Nielsen measures U.S. viewership. Meaning we can compare U.S. viewership to the rest of the world in an “apples-to-apples” manner.
The hours viewed metric does have its own biases. In particular, it favors content that is rewatched a lot. Specifically, kids content. It’s not like tens of millions of Americans are watching CoComelon each week. Instead, a very small number of kids watch it all the time. Unique households helps reveal that difference.
(By the way, if you’d like another explainer on the difference between various metrics, check out this article I wrote from a few years back.)
But Maybe It Doesn’t Matter: All the Data Is Correlated
So both metrics are useful, but guess what? It may not matter.
If you take nothing away from this article, take this: success in content is correlated.
Think of big hit. Like Squid Game. It’s the top Netflix series in terms of total customers watching, total hours viewed, and, probably, completion rate. And it’s highly rated on IMDb. In other words, successful shows are successful in most metrics.
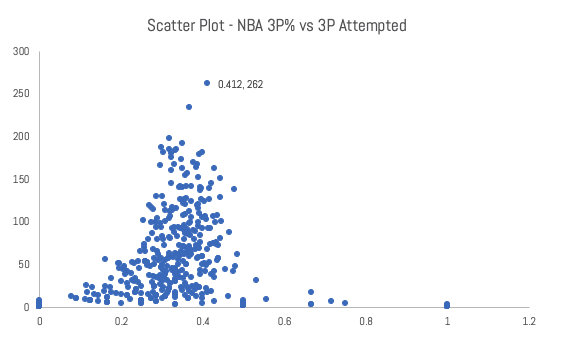
And I can illustrate this with a visual:
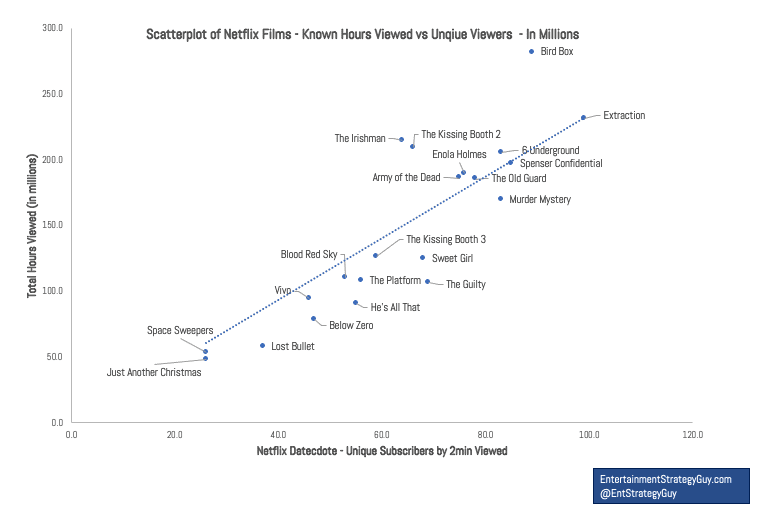
That’s a scatter plot of unique customers versus hours per customers for both TV and film.
Essentially, the goal for any show is to get as high to the up and right as possible. That means lots of people are watching and watching for a long time. The trend line goes up and to the right, because the amount of total hours viewed is correlated with the number of unique customers.
(I made the two charts by syncing all the Netflix datecdotes over the last three years with the top ten most popular hours charts they’ve released. In some cases, I used estimates from the Netflix Hours Viewed for series with four weeks of viewership.)
So do I wish Netflix would release unique subscribers for all their shows going forward too? Obviously. More data is better.
But I can’t be mad. Netflix dropped 800 new data points. The most from a streamer ever. And while I’ll miss the old “datecdotes”, by this time next year we’ll have a lot of data to analyze.
(If you enjoyed this data dive, check out my other writings over at my (newly redesigned) website, sign up for my newsletter, or follow me on Twitter.
In particular, each week I publish a “Streaming Ratings Report” compiling multiple data sources to unpack how content is performing on streaming each week. Check it out.)